Abstract
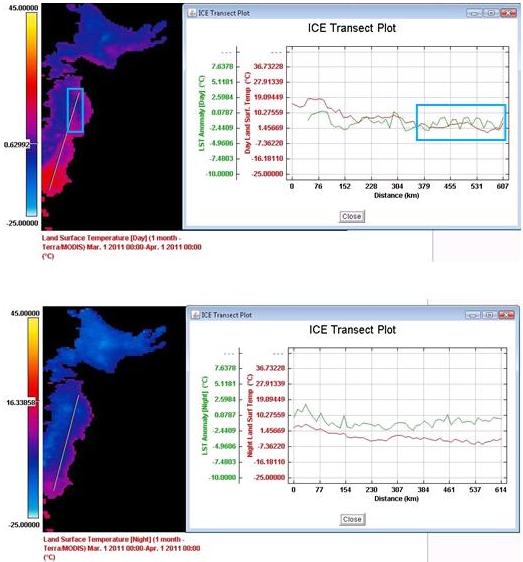
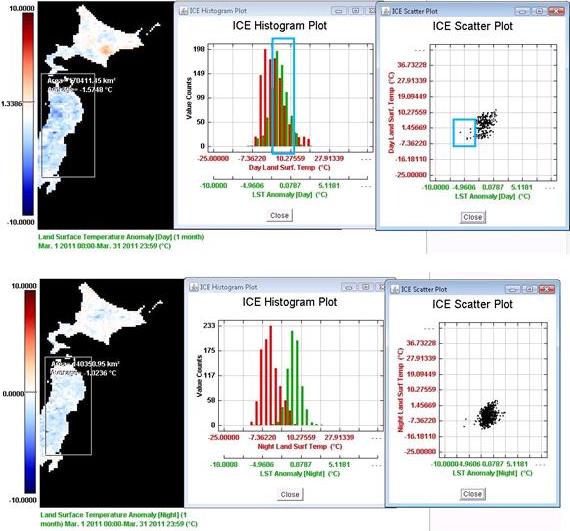
It was observed in this study that there was short-term temporal increase and decrease in land surface temperature of the region along the east-north Honshu Island, near the epicentre. Furthermore, temperature anomaly compared with meteorological data history from several meteorological station around epicentre. Between March 13rd to March 15th, trend of temperature was increase after the big earthquake and had been decreasing since March 15th to March 16th. Then we compared the Landsat result with Terra/MODIS Land Surface Temperature and Land Surface Temperature Anomaly at day and night on March 2011. We found the anomaly behaviour along the east-north side of Honshu Island at daytime. This is showing us that could be the two plates (Pacific Plate – North American Plate) gradually began to release the stress, with the presence of more than hundreds aftershock event
Main article
The 9.0M earthquake hit Sendai on the end of winter season, on March 11st, 2011, which led to the death of 14,435 people, injured more than 5,314, and damage 76,713 houses (totally collapse) [1]. Sendai has a moderate, specifically humid temperate zone (Koppen Cfa), when winters season are cool and relatively dry, with January averaging at 1.5 °C, February averaging at 1.7°C, and March averaging at 4.5 °C. The early winters come on December with averaging high temperature at 4.3 °C [2].
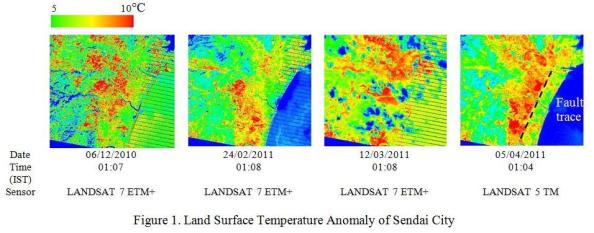
Our understanding of the earth and the phenomena on the surface keep growing with the expanding of satellite imagery technology. Land Surface Temperature (LST) maps generated from thermal images of LANDSAT TM and ETM+ datasets can be used to monitor the Earth’s thermal regime for any change that might be induced by an earthquake. The thermal channels (6) of the sensor of LANDSAT satellites were used to study the LST for Sendai to look for any change in the thermal character of Tohoku Region, Japan, induced by the earthquake of March 11st 2011 and its aftershocks. Our analysis on the time series LST maps, a thermal anomaly was seen building up on the day of December 6th, 2010. This anomaly showed a maximum rise on the day of March 12nd, 2011, just a few hours after the main shock. The earthquake occurred on March 11, 2011. A more intense anomaly was seen to persist towards the west of the epicentrum (figure 1) pararel with the Shikaochizaka fault, the Dainenjiyama fault, and the Nagamachi-rifu fault . This anomaly faded finally with the disappearance of the aftershocks (April 5th, 2011).
Temperature for December 6st, 2010 was at 4°C, on this day the weather was normal without a precipitation and snowfall (figure. 2). Temperature for February 24th, 2011 was at 2°C, on this day the weather was cloudy and there was a presence of fog (figure. 3). From satellite imagery analysis on February 24th, there was concentration of heat on the land surface, coincide with the three fault trace location. Temperature for March 12nd, 2011 is at 3°C, in this day the weather was sunny but cold (figure. 4), time acquisition of the imagery on this day was just a few hours after big earthquake. From the thermal image we found that there was an increase of land surface temperature, covered almost all of the Sendai City (the blue color on the image is cloud cover). April 5th, the temperature was at 10°C, on this day the weather was normal, there was no precipitation event and warmer than the other observation date (figure. 5)[3]. The thermal image show us in this day the land surface temperature gradually decrease from the near coast, but there was appereance of heat, the orientation and location of the thermal anomaly, was seen to surface, consistent with the spatial orientation of three fault trace.
Figure 4. show us that the trend of temperature was increase after the big earthquake (from March 13rd to March 15th ), and had been decreasing since March 15th to March 16th. This is showing us that could be the two plates (Pacific Plate – North American Plate) gradually began to release the stress, with the presence of more than hundreds aftershock event (figure. 6).

The time series of land surface temperature anomaly of Sendai City was seen consistent with the spatial orientation of the Shikaochizaka fault, the Dainenjiyama fault, and the Nagamachi-rifu fault trace.The location of the thermal anomaly, which was seen to surface as a prelude to the earthquakes.
Then we compared the Landsat result with Terra/MODIS Land Surface Temperature and Land Surface Temperature Anomaly at day and night on March 2011. We found the anomaly behaviour along the east-north side of Honshu Island at daytime.
Land surface temperature is how hot or cold the ground feels to the touch. An anomaly is when something is different from average. These maps show where Earth’s surface was warmer or cooler in the daytime and nighttime than the average temperatures for the same week or month from March 2011. So, a land surface temperature anomaly map for March 2011 shows how that month’s average temperature was different from the average temperature for all Marchs between February and April 2011.


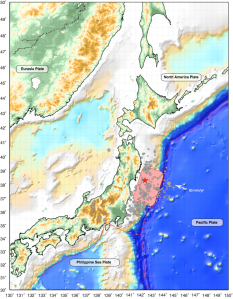
The 9.0M earthquake on March 11st, 2011, which occurred near the northeast coast of Honshu, Japan, resulted from thrust faulting on or near the subduction zone plate boundary between the Pacific and North America plates (figure 6). At the latitude of this earthquake, the Pacific plate moves approximately westwards with respect to the North America plate at a rate of 83 mm/yr, and begins its westward descent beneath Japan at the Japan Trench [4].

The location, depth, and focal mechanism of the March 11 earthquake are consistent with the event having occurred on the subduction zone plate boundary. If we trying to make schematic 3D model of of the subsurface location of March 11st, 2011, earthquake epicentrum, focus and location of three faults, it could be like the following figure.
Figure 8. Schematic 3D model of of the subsurface location of 11 March 2011 earthquake epicentre, focus and location of three faults. (Adopted from: Saraf and Choudhury, 2005 [5])
The March 11st earthquake was preceded by a series of large foreshocks over the previous two days, beginning on March 9th with a 7.2M event, and continuing with another three earthquakes greater than 6M on the same day. Due to the availability of satellite data, we can only observe from February 24th and March 12nd, 2011. Day by day observation is importantly needed for further study.
However, this early study need more analysis of geological and meteorological time series ground data of the Sendai City to understand the earthquake that induced thermal anomalies.
References
[1] National Police Agency of Japan. Emergency Disaster Countermeasures Headquarters. http://www.npa.go.jp/archive/keibi/biki/higaijokyo_e.pdf Retrieved on April 11, 2011
[2] “気象庁 / 平年値(年・月ごとの値)”. Japan Meteorological Agency.
http://www.data.jma.go.jp/ Retrieved on April 27, 2011
[3] Meteorological data history from http://www.wunderground.com/history/ Retrieved on April 28, 2011
[4] United States Geological Service (USGS). http://earthquake.usgs.gov/ Retrieved on April 6, 2011
[5] Saraf, A.K., Choudhury, S., 2005. Satellite detects surface thermal anomalies associated with the Algerian earthquakes of May 2003. International Journal of Remote Sensing 26 (13), 2705–2713.


Leave a comment